- Home
- Sustainability
- ESG Data
- Balance of Input & Output
Balance of Input & Output
Balance of Input & Output
The Sumitomo Forestry Group accurately understands how its business activities impact the environment and make evaluations and manage them in its environmental management. As such, data on environmental impact is collected at each stage from energy and raw material input to manufacturing and disposal per plant and business to utilize them for reduction initiatives.
Fiscal 2024 Sumitomo Forestry Group Balance of Input & Output*
-
Energy input (TJ) 9,958Purchased electricity (1,000MWh) 242Petroleum (1,000kL) 18Gas (1,000m3) 3,207Coal (1,000t) 15Wood waste (1,000t) 538Palm kernel shells (PKS, etc.) (1,000t) 33Non-industrial steam (TJ) 4Water consumption (1,000m3) 2,939
-
Raw materials (1,000t) 2,456Timber 1,750Metal 25Plastic 54Paper 2Adhesives, coatings, reagents 76Concrete 340Glass, ceramics, and non-combustible building materials 87Crushed stone 92Housing equipment 7Other 23Seedlings (1000 trees) 1,805
-
ProductBuilding, housing materials (1,000t) 57Potting mix (1,000t) 19Chips (1,000t) 332MDF (1,000m3) 297PB (1,000m3) 396LVL, plywood (1,000m3) 190Lumber / laminated engineered wood (1,000m3) 16Kitchen cabinets (1,000 units) 77Woodworking / others (1,000t) 91Quantity harvested at company owned forests (1,000m3) 72Seedling production
(1000 seedlings) 2,251Unused wood resources (1,000m3) 16 Transmission (1,000MWh) 442
 Number of delivered domestic household sales 7,806Number of delivered overseas household sales 14,554
-
Waste (1,000t)Total generated 425Final landfill amount 20Greenhouse gas emissions (1,000t-CO2e)
(Scope 1,2) 155 -
Chemical substance waste
released (t) 10Waste water discharge (1,000m3) 871Greenhouse gas emissions
(1,000t-CO2e)
(Scope 3) 10,735
* The period of data collection for fiscal 2024 is from January 1 to December 31, 2024
* The calorific conversion factor for electricity is 3.6 GJ/MWh
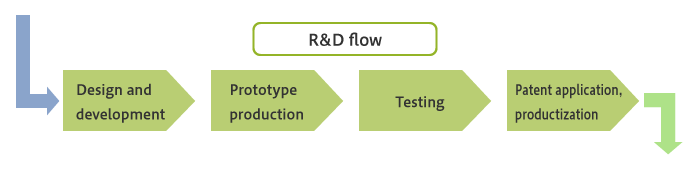
Research & Development*
-
Energy input (TJ) 14Purchased electricity (1,000MWh) 3Petroleum (1,000kL) 0.02Gas (1,000m3) 82Wood waste (1,000t) 0.025
-
Water consumption (1,000m3) 6
-
Transmission (1,000MWh) 0.04Waste (1,000t)Total generated 0.15Final disposal amount 0.00
-
Chemical substance waste
released (t) 0Greenhouse gas emissions
(1,000t-CO2e) 1Waste water discharge (1,000m3) 6
* Subject: Tsukuba Research Institute
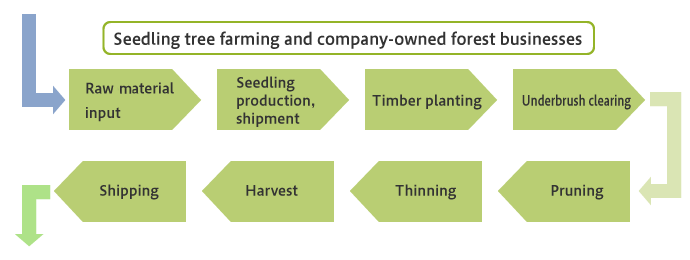
Forest Management*
-
Energy input (TJ) 6Purchased electricity (1,000MWh) 0.26Petroleum (1,000kL) 0.12Wood pellet (1,000t) 0.02
-
Raw materialsDomestic forest raw materials
(seedling shipment [1,000]) 1,805Water consumption (1,000m3) 54
-
ProductQuantity harvested at company owned forests (1,000m3) 76Seedling production (1,000) 2,251Unused wood resources (1,000m3) 16
-
Greenhouse gas emissions (1,000t-CO2e) 0.4
* Subjects: Forestry Offices (Hyuga, Niihama, Osaka, and Mombetsu) and seedling tree farming centers (Togo, Motoyama, Gifu, Watarase, and Mombetsu)
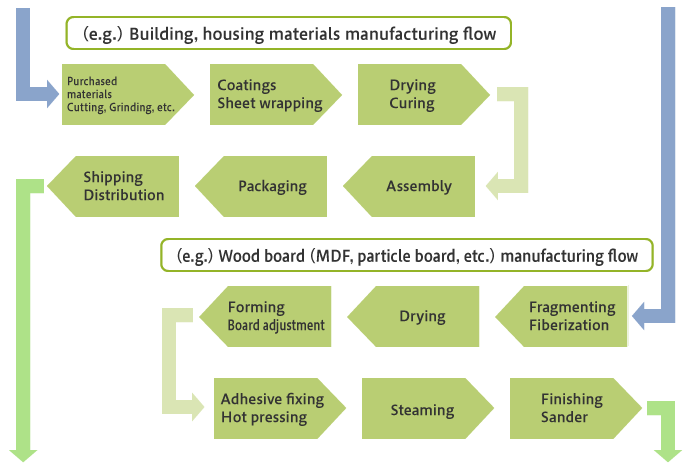
Manufacturing Business*
-
Energy input (TJ) 2,320Purchased electricity (1,000MWh) 191Petroleum (1,000kL) 3Gas (1,000m3) 1,536Wood waste (1,000t) 85Waste plastic (1,000t) -Water consumption (1,000m3) 935
-
Raw materials (1,000t) 1,783Timber 1,644Metal 2Plastic 42Paper 1Adhesives, coatings, drugs 71Purified soil others 19Other 4
-
ProductBuilding, housing materials (1,000t) 57Potting mix (1,000t) 19Chips (1,000t) 332MDF (1,000m3) 297PB (1,000m3) 396LVL, plywood (1,000m3) 190Lumber / laminated engineered wood (1,000m3) 16Kitchen cabinets (1,000) 77Woodworking / others (1,000t) 91
-
Chemical substance waste released (t) 9Waste (1,000t)Total generated 230Final disposal amount 10Greenhouse gas emissions (1,000t-CO2e) 63Waste water discharge (1,000m3) 361
*Subjects: Sumitomo Forestry Crest (Kashima Plant, Shizuoka Plant, Niihama Plant, Imari Plant, and Tobishima Logistics Center), Sumitomo Forestry Landscaping (Tobishima Plant and Shinshiro Plant), Moku-kan-no-Mori, Japan Bio Energy, Okhotsk Bio Energy, Michinoku Bio Energy, Kutai Timber Indonesia (KTI, Indonesia), Sinar Rimba Pasifik (SRP, Indonesia), AST Indonesia (ASTI, Indonesia), Nelson Pine Industries (NPIL, New Zealand), Vina Eco Board (VECO, Vietnam), Canyon Creek Cabinet Company (CCC, America), and Pan Asia Packing (PAP, Thailand)
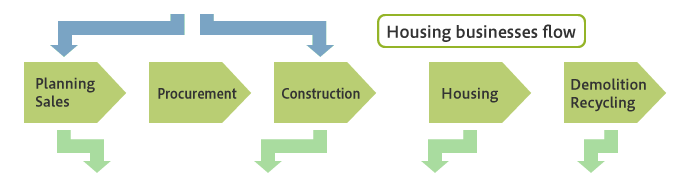
Housing Business (Domestic New Construction)*
-
Energy input (TJ) 171Purchased electricity (1,000MWh) 12Petroleum (1,000kL) 4Gas (1,000m3) 73Non-industrial steam (TJ) 1Water consumption (1,000m3) 51
-
Raw materials (1,000t) 668Timber 106Metal 23Plastic 12Concrete 340Paper and Textiles 1Glass, ceramics, and non-combustible building materials 87Crushed stone 92Housing equipment 7
-
Greenhouse gas
(1,000t-CO2e)
(Scope 1,2) 11Transmission (1,000MWh) 0.15 -
Facilities completed in 2024 (buildings) 7,806Average total floor
area (m2) 120.9Waste from new housing construction (1,000t)Total generated 21Final disposal amount 1 -
Greenhouse gas emissions
(1,000t-CO2e)
(Scope 3) 1,417 -
Demolition waste
(1,000t)Total generated 93Final disposal amount 3
* Subjects: Sumitomo Forestry Housing Division, Sumitomo Forestry Home Engineering, and Sumitomo Forestry Architecno
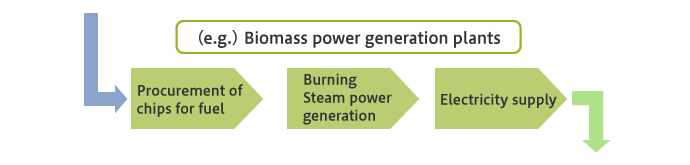
Power Generation Business*
-
Energy input (TJ) 6,888Purchased electricity (1,000MWh) 1Petroleum (1,000kL) 0.3Gas (1,000m3) 0.1Wood waste (1,000t) 454Palm kernel shells (PKS, etc.) (1,000t) 33Coal (1,000t) 15
-
Raw materials (1,000t)Adhesives, coatings, drugs 5Water consumption (1,000m3) 1,436
-
Transmission (1,000MWh) 438Chemical substance waste released (t) 1Greenhouse gas emissions (1,000t-CO2e) 42Waste water discharge (1,000m3) 504
-
Waste (1,000t)Total generated 9Final disposal amount 0
* Subjects: Mombetsu Biomass Electric Power, Hachinohe Biomass Electric Power
- Click here for related information
- Home
- Sustainability
- ESG Data
- Balance of Input & Output