- Home
- Sustainability
- ESG Data
- Material Balance
Material Balance
Material Balance
For a company to promote environmental management through the appropriate evaluation and control of the impact its business has on the environment, it is essential to accurately understand the details of the impact. For this purpose, the Sumitomo Forestry Group collects data on its environmental impact from each plant and business for a range of production processes from energy and raw material input to manufacturing and disposal. The data are compiled to be used to carry out impact reduction measures.
Sumitomo Forestry Group’s Material Balance for Fiscal 2025
INPUT
-
Energy input (TJ) 9,799Purchased electricity (1,000 MWh) 251Petroleum (1,000 kL) 19Gases (1,000 m3) 2,920Coal (1,000 t) 13Wood waste (1,000 t) 528Palm kernel shells (PKS), etc. (1,000 t) 30Non-industrial steam (TJ) 5Water consumption
(1,000 m3) 2,895 -
Raw materials (1,000 t) 2,188Timber 1,514Metals 26Plastics 15Paper 2Adhesives, coatings, reagents 78Concrete 345Glass, ceramics, non-combustible building materials 88Crushed stone 93Housing equipment 7Other 21Seedlings (1,000) 1,972
BUSINESS ACTIVITIES
-
ProductsBuilding and housing materials
(1,000 t) 59Potting mix (1,000 t) 17Chips (1,000 t) 336MDF (1,000 m3) 326PB (1,000 m3) 366LVL, plywood (1,000 m3) 181Lumber, laminated wood (1,000 m3) 13Kitchen cabinets (1,000 units) 51Woodwork, other (1,000 t) 0Quantity harvested from company-owned forests (1,000 m3) 47Seedlings produced (1,000) 1,914Unused wood resources (1,000 m3) 17 Power transmission
(1,000 MWh) 435 Domestic home sales
(number of units delivered) 7,968Overseas home sales
(number of units delivered) 14,554
OUTPUT
-
Industrial waste (1,000 t)Total generated 77Final landfill amount 12Greenhouse gas emissions
(1,000 t-CO2e)
(Scopes 1, 2) 146 -
Chemical substance waste released (t) 94Waste water discharged (1,000 m3) 1,423Greenhouse gas emissions
(1,000 t-CO2e)
(Scope 3) 11,220
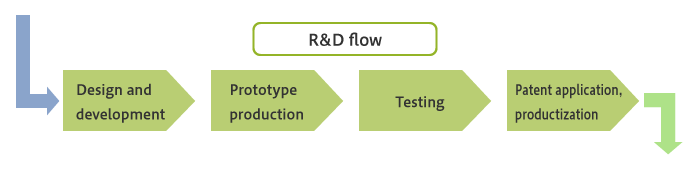
Research & Development
INPUT
-
Energy input (TJ) 11Purchased electricity (1,000 MWh) 2Petroleum (1,000 kL) 0.02Gases (1,000 m3) 47Wood waste (1,000 t) 0.03
-
Water consumption (1,000 m3) 7
OUTPUT
-
Power transmission
(1,000 MWh) 0.04Industrial waste, etc. (1,000 t)Total generated 0.14Final landfill amount 0.01 -
Chemical substance waste released (t) 0Greenhouse gas emissions
(1,000 t-CO2e) 0.8Waste water discharged (1,000 m3) 7
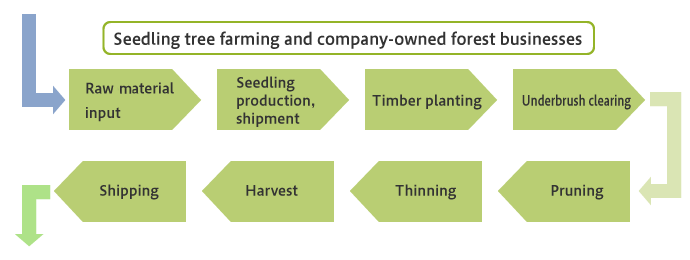
Forest Management
INPUT
-
Energy input (TJ) 6Purchased electricity (1,000 MWh) 0.27Petroleum (1,000 kL) 0.13Wood pellet (1,000 t) 0.04
-
Raw materialsDomestic forest raw materials
(Seedlings shipped [1,000]) 1,972Water consumption (1,000 m3) 56
OUTPUT
-
ProductQuantity harvested from company-owned forests (1,000 m3) 47Seedlings produced (1,000) 1,914Unused wood resources (1,000 m3) 17
-
Greenhouse gas emissions
(1,000 t-CO2e) 0.4
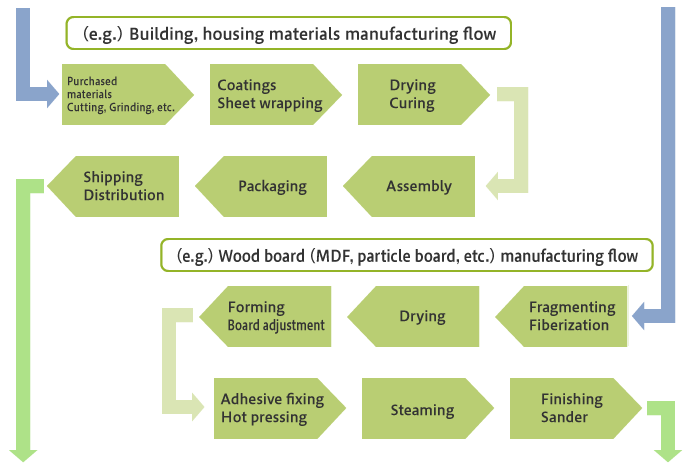
Manufacturing Business
INPUT
-
Energy input (TJ) 2,301Purchased electricity (1,000 MWh) 196Petroleum (1,000 kL) 3Gases (1,000 m3) 1,288Wood waste (1,000 t) 83Waste plastics (1,000 t) -Water consumption (1,000 m3) 890
-
Raw materials (1,000 t) 1,507Timber 1,407Metals 2Plastics 2Paper 1Adhesives, coatings, reagents 74Water treatment sludge, etc. 17Other 4
OUTPUT
-
ProductBuilding and housing materials
(1,000 t) 59Potting mix (1,000 t) 17Chips (1,000 t) 336MDF (1,000 m3) 326PB (1,000 m3) 366LVL, plywood (1,000 m3) 181Lumber, laminated wood (1,000 m3) 13Woodwork, other (1,000 t) 51 -
Chemical substance waste released (t) 97Industrial Waste (1,000 t)Total generated 197Final landfill amount 3Greenhouse gas emissions
(1,000 t-CO2e) 57Waste water discharged
(1,000 m3) 916
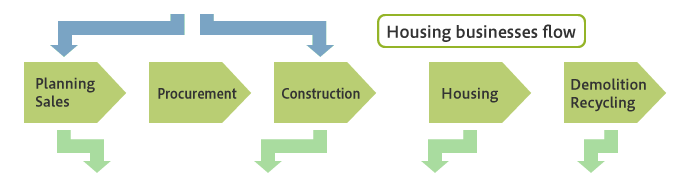
Housing Business (Domestic New Construction)
INPUT
-
Energy input (TJ) 172Purchased electricity (1,000 MWh) 13Petroleum (1,000 kL) 4Gases (1,000 m3) 77Non-industrial steam (TJ) 1Water consumption (1,000 m3) 48
-
Raw materials (1,000 t) 677Timber 107Metals 24Plastics 12Concrete 345Paper and textile goods 1Glass, ceramics, non-combustible building materials 88Crushed stone 93Housing equipment 7
OUTPUT
-
Greenhouse gas emissions
(1,000 t-CO2e)
(Scopes 1, 2) 8Power transmission
(1,000 MWh) 0.15 -
Projects completed
(number of building delivered) in 2025 7,968Average total
floor area (m2) 120.9Industrial Waste (New Construction) (1,000 t)Total generated 18.8Final landfill amount 0.7 -
Greenhouse gas emissions
(1,000 t-CO2e)
(Scope 3) 1,432 -
Demolition waste
(1,000 t)Total generated 95.8Final landfill amount 3.2
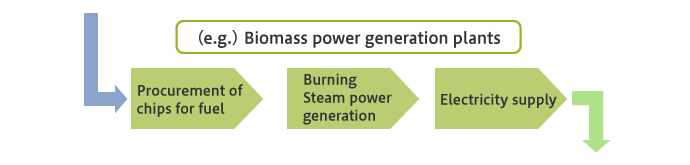
Power Generation Business
INPUT
-
Energy input (TJ) 6,673Purchased electricity (1,000 MWh) 1Petroleum (1,000 kL) 0.3Gases (1,000 m3) 0.1Wood waste (1,000 t) 445Palm kernel shells (PKS), etc. 30Coal (1,000 t) 13
-
Raw materials (1,000 t)Adhesives, coatings, reagents 5Water consumption (1,000 m3) 1,431
OUTPUT
-
Power transmission
(1,000 MWh) 431Chemical substance waste released (t) 0Greenhouse gas emissions
(1,000 t-CO2e) 38Water consumption (1,000 m3) 501 -
Industrial Waste (1,000 t)Total generated 12.0Final landfill amount 0.08
- Click here for related information
- Home
- Sustainability
- ESG Data
- Material Balance